


The Shooting Star candlestick is a single-bar price pattern that technical analysts use to show that an uptrend may be running out of steam and that a bearish reversal may be on the way. It has a small real body near the bottom of the candle’s range, a long upper wick (at least twice the length of the body), and little to no lower wick. This article from MEXQuick Academy will break down the shooting star candlestick pattern, looking at its structure, the psychology behind it, the important confirmation requirements, and how it is understood in different asset classes. We only want to give you a data-driven educational framework. We don’t want to give you financial advice or promise you profits.
What is a Pattern of Shooting Stars in Candlesticks?
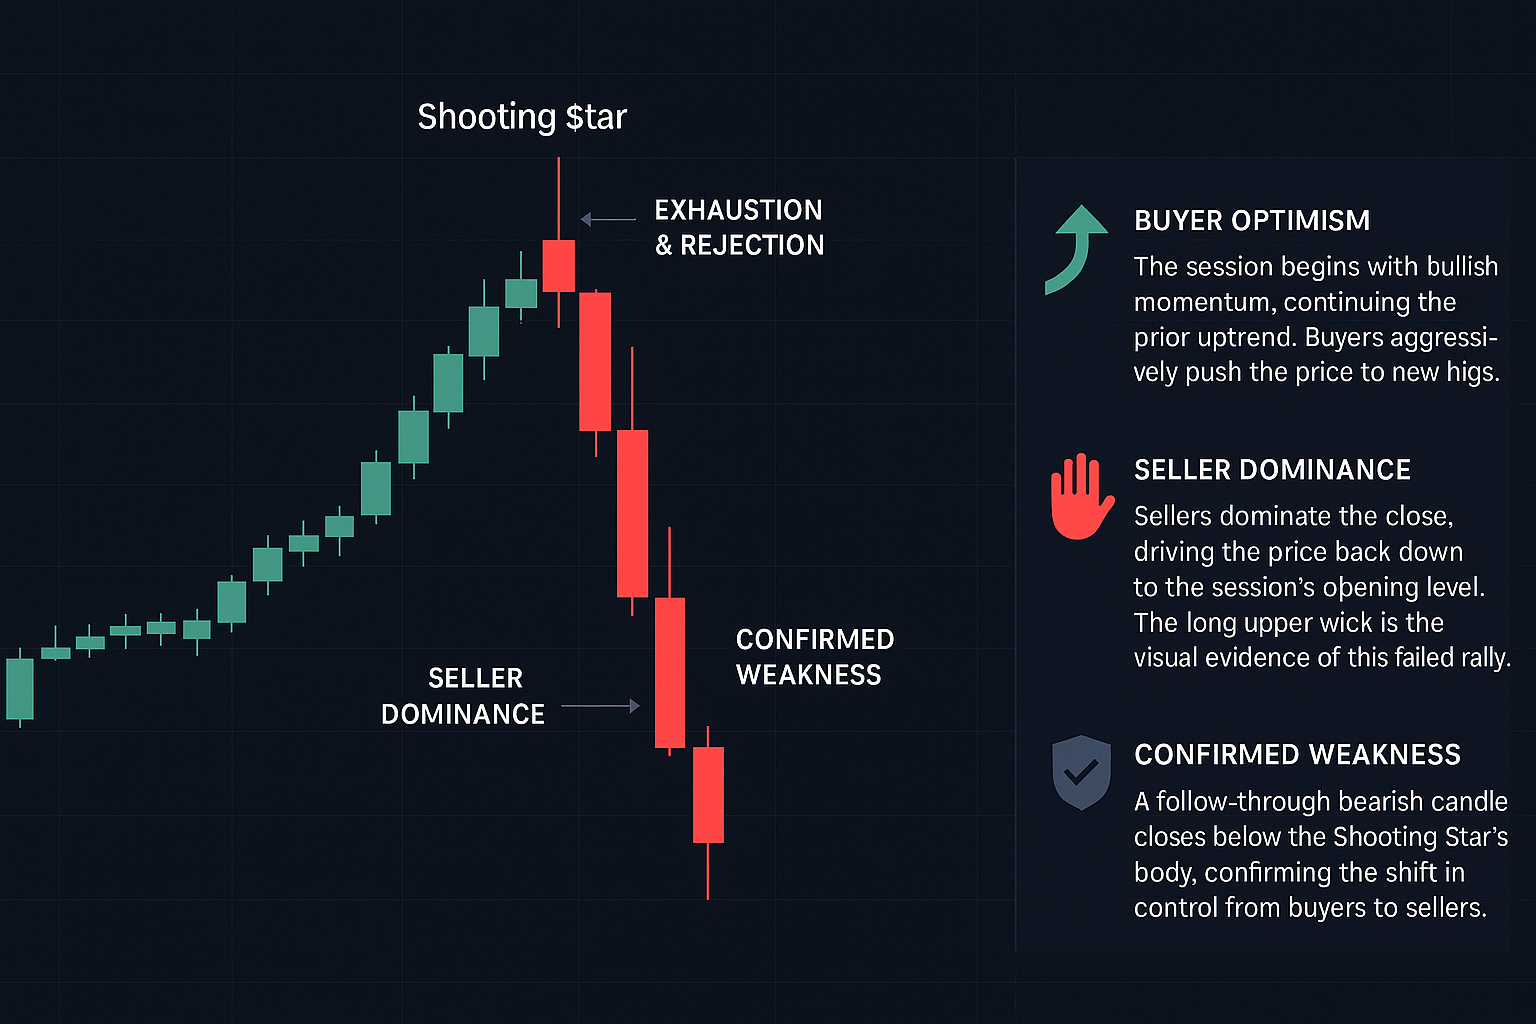
A Shooting Star candlestick pattern is a bearish reversal pattern that happens at the top of an uptrend. It is part of a group of candlestick patterns that show rejection and the possibility of a trend change. The main story behind the Shooting Star is that bullish momentum didn’t work. During the session, buyers first push prices up a lot, which makes the long upper wick. But by the end of the session, sellers had taken over from buyers, bringing the price back down to near the session’s open. This makes a small body at the bottom of the trading range, which shows that the previous bullish excitement was not accepted. Options in Binaries
The pattern’s meaning comes almost entirely from the situation it is in. A shooting star after an uptrend signal is important because it happens at a time when the overall bullish mood may have gone too far. It shows a fight between bulls and bears, with the bears winning by the end of the day. This suggests that the buying power that drove the previous rise may be running out. For analysts, it is a strong hint, a warning sign of possible weakness that calls for more attention to other confirming indicators. As a single-bar pattern, it shows potential, not a guaranteed reversal. This is an important idea in disciplined, data-driven trading.
How to Find a Shooting Star Candle?
- A Clear Uptrend: The pattern must happen during a clear uptrend. A candle that looks like a Shooting Star but is in a downtrend or sideways market is not a real Shooting Star and means something else. The price action before this should show a clear and steady rise.
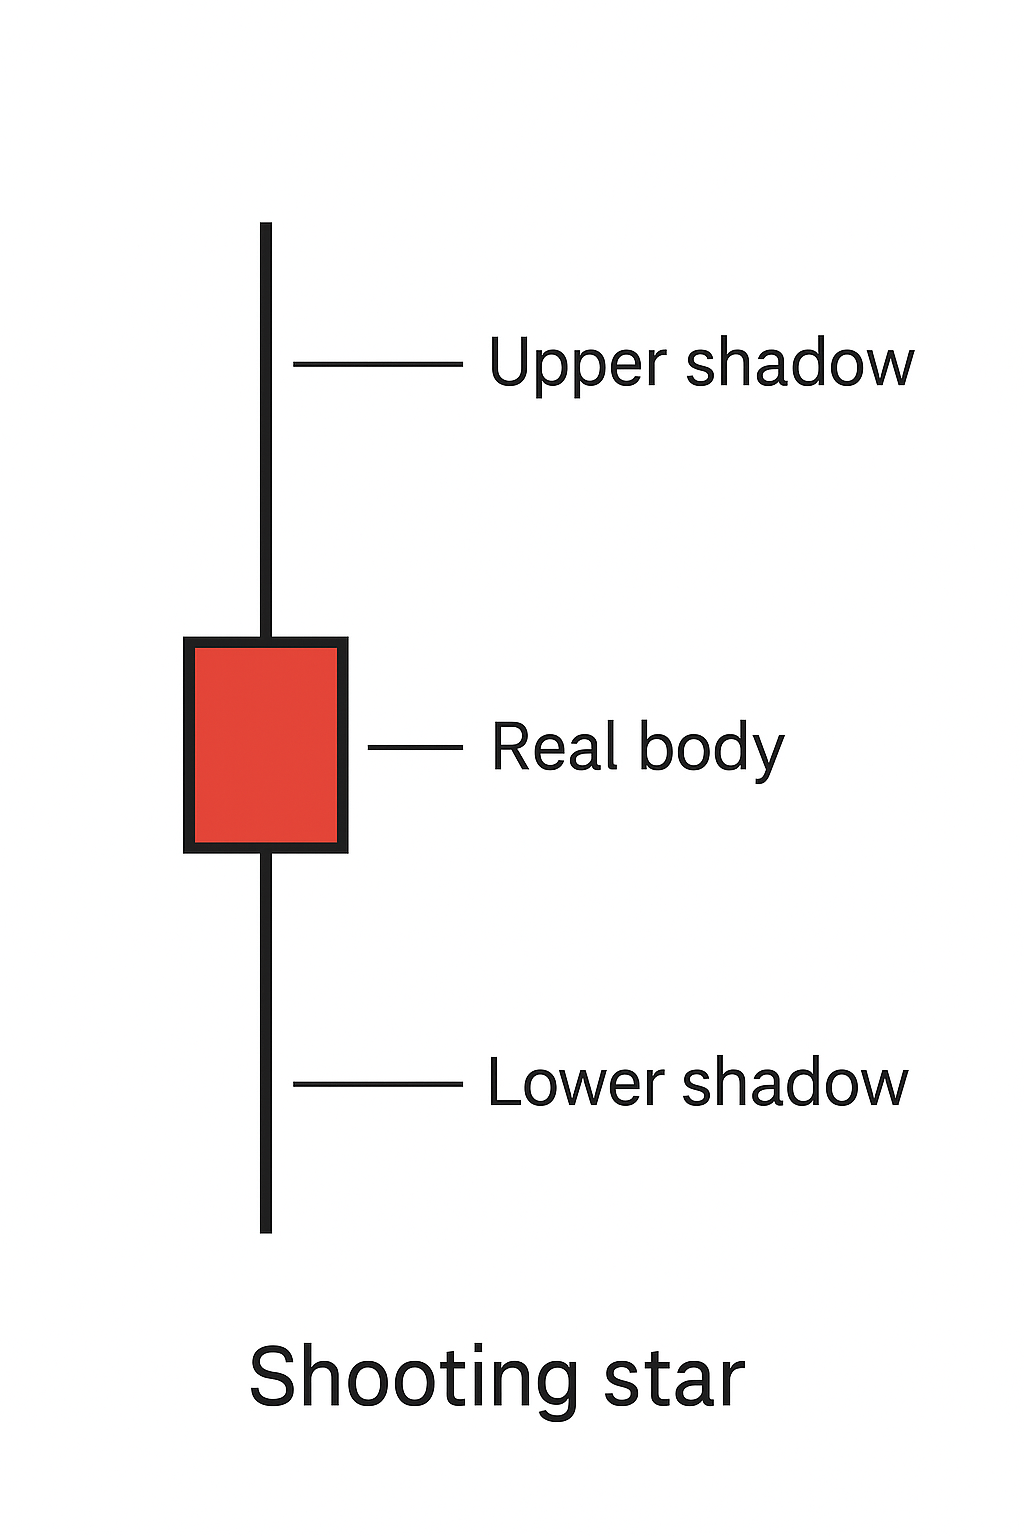
- A Small Real Body at the Bottom: The candle should have a small real body, which is the space between the open and close. The color of the body (red/black for a down close or green/white for an up close) is not as important as the body itself. However, a bearish (down) close can be seen as a sign of stronger sellers. The most important thing is that the body is at the bottom of the candle’s total range. MEXQuick Blogs
- A Long Upper Wick: The upper wick, also called the shadow, must be at least twice as long as the real body. A longer wick means that the session’s highs are being rejected more strongly. This is the most important visual part of the pattern.
A classic Shooting Star candlestick has a very small or no lower wick. The ideal form shows that the session’s low was almost at the close, and there wasn’t a big bounce back from the lows after the sell-off.
Traders often use the “wick-to-body ratio” as a quantitative filter when they are learning how to spot shooting star candlestick patterns. A ratio of 2:1 or higher (upper wick length : body length) is the minimum standard, but 3:1 is a much stronger signal. This objective measure helps get rid of candles that aren’t clear and strengthens a disciplined, rule-based way of recognizing patterns.
The Psychology of Pattern Buyer Exhaustion and Seller Rejection
The way a Shooting Star candlestick forms clearly shows how the mood of the market changed over the course of a single trading period. Knowing this story is what makes a good analyst different from someone who just remembers shapes. The pattern is a clear example of an uptrend that has run out of steam and then been rejected.
The session starts, and people are still optimistic about the market. Buyers, sure of the previous trend, enter the market and bid the price up aggressively. As the price makes a new high for the move, this makes the long upper wick. But when prices are this high, one of two things usually happens, both of which end up with the same result.
First, sellers (who could be people who bought earlier and want to make money or new short-sellers) see the high price as a good chance. They start to take in supply at high prices, which makes it hard for new buy orders to get through. Second, there aren’t as many new buyers; the rally has used up all the demand at that price level. In this case, the market “grabs” liquidity above the previous high before changing direction.
Shooting Star vs. Inverted Hammer, Evening Star, and Gravestone Doji
To do a good analysis, you need to be able to tell the difference between similar candlestick patterns. People often get mixed up between the Shooting Star and the Inverted Hammer and the Shooting Star and the Gravestone Doji.
- These two patterns, Shooting Star and Inverted Hammer, look the same. The most important difference is the situation in which they are used. A Shooting Star is a bearish pattern that forms at the top of an uptrend. At the bottom of a downtrend, an Inverted Hammer forms. It is a bullish reversal pattern. It means that buyers are trying to break through resistance, even though the close is still close to the open.
- A Gravestone Doji is a more extreme version of a Shooting Star. The open and close prices are the same, but the upper wick is long and the lower wick is not. This makes a cross shape with no real body. The Gravestone Doji shows an even stronger rejection because the session closed at the same price as it opened, wiping out all of the gains made during the session.
- Shooting Star vs Evening Star: This is a comparison of a pattern with one candle and one with three candles. There is only one bar in the Shooting Star. The Evening Star is a major bearish reversal pattern made up of three candles: a long bullish candle, a small-bodied candle (which can be a Doji or a Shooting Star) that gaps above the first candle, and a third long bearish candle that closes well into the body of the first.
Volume, Next Candle, RSI, and Key Levels for Confirmation

A single Shooting Star candlestick is just a warning. You need to see a shooting star candlestick before you can act on it. Disciplined traders wait for more proof that sellers are really in charge. This makes the pattern much more accurate and helps traders avoid false signals.
- Bearish Confirmation Candle: The most direct sign of confirmation is a bearish candle that closes below the real body of the Shooting Star. This “follow-through” shows that the selling pressure has continued after the Shooting Star’s first rejection.
- Volume Analysis: A shooting star with a volume spike on the day it forms is a strong sign that it is real. A lot of volume means that the rejection was a big deal that a lot of people in the market were involved in. It shows that the selling pressure is strong.
- Momentum Divergence: An oscillator like the Relative Strength Index (RSI) can add a strong layer of confirmation. A shooting star RSI divergence happens when the price makes a new high but the RSI makes a lower high.
- Rejection at a Key Level: The pattern is more important when it happens at a well-known technical level.
Entry, Stop-loss, and Risk-to-Reward Planning for Strategy Frameworks
To use the Shooting Star candlestick in a systematic trading plan, you need to have clear rules for when to enter and exit trades and a focus on managing risk. You can try to download the best stock trading apps in the UK.
- Entry Trigger: A safe and common way to enter is to put in a sell order (or short order) after the confirmation candle closes below the body of the Shooting Star. Some traders might decide to enter when the price breaks below the Shooting Star’s low. The most important thing is to have a set trigger that goes beyond the pattern’s formation.
- Stop-Loss Placement: For a shooting star risk management stop-loss, the logical level is above the high of the Shooting Star’s long upper wick. If the price goes above this level, it means that the sellers who made the pattern have been overwhelmed, and the bearish signal is no longer valid. It is a good idea to use a trailing stop above the wick.
- Profit Targets and Risk-to-Reward Ratio: Targets should be set based on objective technical levels. These could be the next level of support, a key moving average, or a measured move based on the trend that came before it. A trader needs to figure out the risk-reward ratio before they make any trades.
Mistakes and False Signals That Happen a Lot
Traders can still make common mistakes when trading a Shooting Star candlestick, even if they know how it works;
The most common mistake is to act on the pattern right away, before the confirmation candle closes. This often means that you enter a trade only to see the price go back up, which means you lose.
- Ignoring the Trend Context: Trying to find a Shooting Star in a downtrend or a market that is moving up and down in a range is a basic mistake. Outside of a clear uptrend, the pattern doesn’t mean anything.
- Misreading a False Breakout: A long upper wick can sometimes be a false breakout wick that traps late buyers before the price goes back down. But you can’t be sure if it’s a real reversal or just a short break without confirmation. Traders who are disciplined wait for the market to show its cards.
- Ignoring Volume: If you don’t pay attention to volume, you might act on small price changes that don’t mean anything. A high-volume rejection is like a statement, while a low-volume one is like a whisper.
- Bad Risk-Reward Setup: Even if the pattern itself is technically correct, it’s a mistake to enter a trade where the stop-loss is much bigger than the realistic profit target.
Multiple Timeframes Confluence and Institutional Context
Professional traders don’t often use just one timeframe. To make a setup more likely to work, they look for multi-timeframe confluence. After that, you can use a middle timeframe (like 4 hours) to find the shooting star after the uptrend signal. Finally, you can use a shorter time frame (like 1 hour) to make sure you enter below the low of the confirmation candle. This multi-layered method makes sure that the trade idea fits with the bigger picture of the market.
Also, it is helpful to know what the possible institutional context is. Order flow clues can often be linked to the Shooting Star’s long wick. It could mean that a liquidity pool is being taken out above a previous high, which would cause buy-stops to happen before a sharp turn. This “stop-hunt” or “liquidity grab and fade” is a common thing that happens in today’s markets. The Shooting Star is one of the best examples of this.
Charts for Crypto, Forex, and Stocks
- Shooting Star Candlestick Forex: Volume confirmation (using tick volume as a stand-in) and momentum divergence are very important.
- Shooting Star Candlestick Crypto: The crypto market is very volatile, which can lead to a lot of long-wicked candles. So, it is even more important to confirm a shooting star candlestick. A shooting star candlestick on a Bitcoin chart might be very clear, with a wick that is much longer than the body. This usually means that there was a violent rejection after a quick pump driven by fear of missing out (FOMO). The pattern is more reliable when it forms at a resistance level that has been tested in the past.
- Shooting Star Candlestick Stocks: This pattern works on both daily and intraday timeframes in the stock market. An example of a shooting star candlestick stock might be one that gaps up on earnings, rises even more during the day, and then closes near its open, making a shooting star.